Best Markets for House Hacking in 2026
The strategy is national, but the math is local. Here's where a low-down duplex still pencils comfortably right now — and how to tell which market fits you.
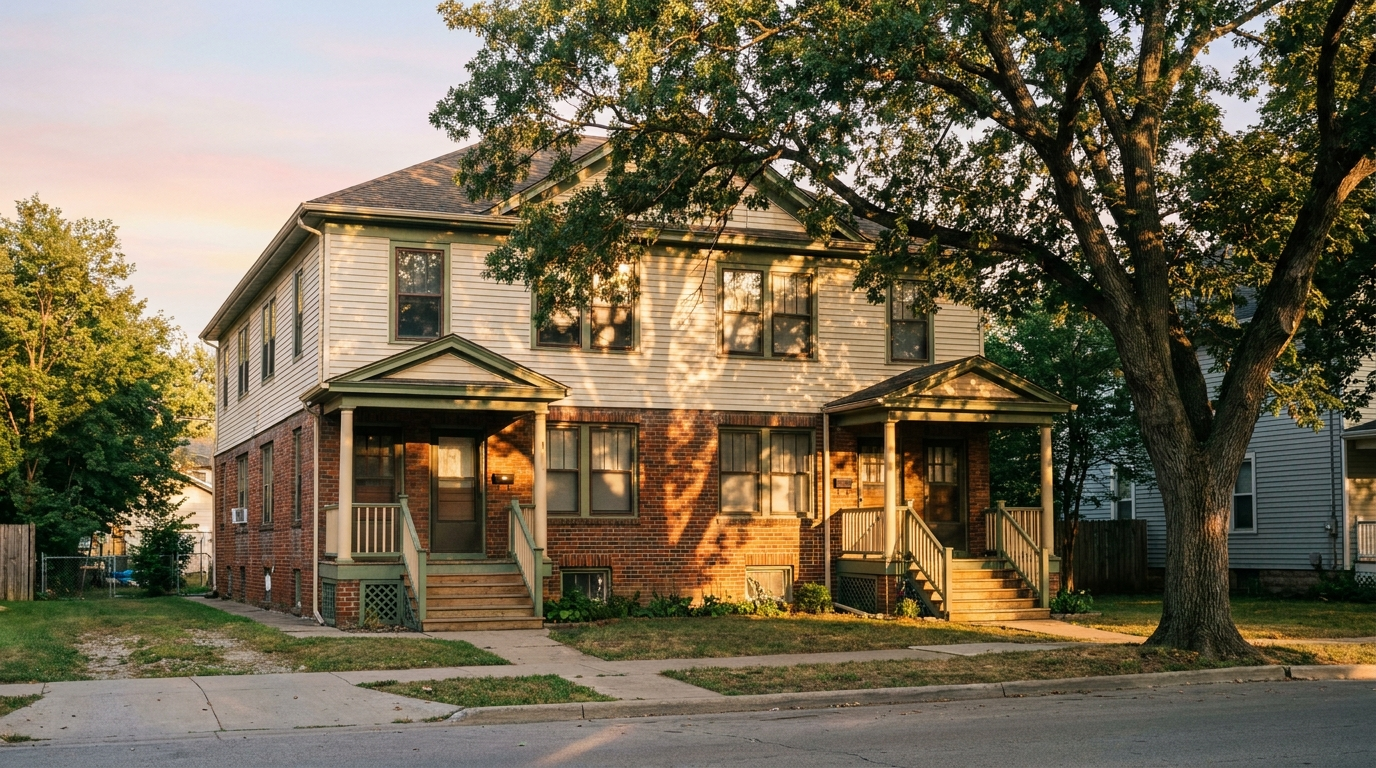
There is no single "best" market for house hacking — there's the best market for you, given your down payment, your risk tolerance, and whether you actually want to live there. But some places make the math dramatically easier than others, and in 2026 they cluster in a recognizable band: affordable Midwest and Southern metros where a two-to-four-unit building costs less than a modest single-family home in a coastal suburb.
We rank markets on four things, in roughly this order: rent-to-price (how much of the payment a tenant's rent covers), entry price (how big a down payment you actually need), FHA-friendliness and inventory (can you find a qualifying building without a bidding war), and carrying costs — the property taxes and insurance that quietly decide whether a cheap sticker price stays cheap.
The shortlist, compared
These are illustrative mid-2026 ranges for two-to-four-unit properties, not quotes. The full, always-current list lives in the Market Explorer and the quarterly Market Pulse report.
| Market | 2–4 unit price | Rent / unit | Est. coverage | Best for |
|---|---|---|---|---|
| Cleveland, OH | $120k–$160k | $850–$1,100 | 65–85% | First-timers wanting margin |
| Detroit, MI | $100k–$150k | $900–$1,150 | 70–90% | Highest coverage, block-by-block diligence |
| Indianapolis, IN | $160k–$210k | $950–$1,250 | 55–75% | Depth, liquidity, job growth |
| Milwaukee, WI | $170k–$230k | $1,000–$1,350 | 55–75% | Duplex-rich stock, higher taxes |
| Memphis, TN | $130k–$180k | $900–$1,200 | 60–85% | No state income tax, deep rentals |
| Montgomery, AL | $120k–$160k | $850–$1,100 | 60–80% | Very low property taxes |
| Pittsburgh, PA | $140k–$190k | $950–$1,250 | 55–78% | Recession-resistant, older stock |
| Rochester, NY | $150k–$200k | $1,000–$1,300 | 55–75% | Strong rents — watch the tax line |
Coverage = market-median rent (after a vacancy allowance) divided by the all-in monthly payment, FHA 3.5% down. Estimates only — verify locally.
How to read the list
The temptation is to sort by the coverage column and buy the top row. Resist it. Detroit posts the highest coverage on paper because its prices are the lowest — but that same low price reflects wide block-by-block variance, and the number that fills your unit is the rent on your street, not the metro median. High coverage rewards diligence; it doesn't replace it.
The middle of the list — Indianapolis, Milwaukee, Pittsburgh — trades a little coverage for depth: more inventory, deeper tenant demand, steadier appreciation, and easier exits. For a first deal you intend to hold, that stability is often worth more than a few points of paper cash flow.
The two columns that decide it
- Property taxes. New York, Illinois, and Wisconsin run high — model the annual bill precisely, because it can erase a low price's advantage.
- Insurance. Louisiana, Mississippi, and the Gulf carry premiums well above the Midwest. Get a real quote before you fall for the sticker.
- Both are in the calculator. Every market's defaults pre-fill realistic tax and insurance, so the number you see already accounts for them.
Midwest or South?
The Midwest — Ohio, Michigan, Indiana, Wisconsin — gives you the country's densest supply of purpose-built duplexes and two-flats, the archetypal house-hack building. You'll pay higher property taxes for it. The South — Alabama, Mississippi, Tennessee, Louisiana — offers lower taxes and, in no-income-tax states, a real annual saving, but a thinner supply of true multi-unit stock and higher insurance. Neither wins outright; the right answer is the one where you'll happily live for a year.
Common pitfalls when choosing
Buyers talk themselves into a market on a single spectacular listing, underwrite the projected rent instead of the lease that exists, or forget that a low price in a high-tax state isn't actually low. The fix is boring and reliable: pick two or three markets you'd genuinely live in, model each on conservative assumptions, and run the gloomy version — a half-point higher rate, one extra vacant month, rents 10% light. A market that survives that is a market worth flying to.
Whatever you shortlist, download the quarterly Market Pulse report for the current ranking and per-market detail — and then make the number yours in the calculator before you make an offer.